Introduction
This is a comparison of a simple online demo photobook implemented with three popular java cloud ready framework :
Status : Work in progess
TODO:
-
benchmark chapter
-
performance comparison chapter
-
resources chapter
Failed to generate image: mmdc failed: Generating single mermaid chart

mindmap
  root((Comparison<br/>goals))
    Deployment
      ::icon(fa fa-paper-plane)
      Java Hotspot jar package JIT
      GraalVM native executable AOT
      Containerized JIT application
      Containerized AOT application
    Java Frameworks
      ::icon(fa fa-mug-hot)
      Micronaut
      Quarkus
      Spring Boot
Copyright
@2024 Matteo Franci - CC BY 4.0 - ATTRIBUTION 4.0 INTERNATIONAL - https://creativecommons.org/licenses/by-nc-sa/4.0/deed.en
All trademarks, logos and brand names are the property of their respective owners. All company, product and service names used in this website are for identification purposes only. Use of these names,trademarks and brands does not imply endorsement.
1. Architecture
This section describes the project architecture.
Failed to generate image: mmdc failed: Generating single mermaid chart
mindmap
root((<br/>Turbo<br/>Photobook))
Documentation
::icon(fa fa-file)
Asciidoc
::icon(fa fa-book)
Mermaid
::icon(fa fa-chart-line)
Implementation
::icon(fa fa-code)
MongoDB 8
::icon(fa fa-leaf)
Node JS 20
::icon(fa fa-cube)
Vite
React
GraalVM Java 21<br>(pick one)
::icon(fa fa-mug-hot)
Micronaut
Quarkus
Spring Boot
Deployment
::icon(fa fa-paper-plane)
Java Hotspot jar package JIT
GraalVM native executable AOT
Containerized JIT application
Containerized AOT application
Failed to generate image: mmdc failed: Generating single mermaid chart

block-beta
columns 2
block:per:2
    columns 2
    persistance["Persistance"]:1
    mongo[("MongoDB")]
    style per fill:#9d9,stroke:#333,stroke-width:4px
end
blockArrowLink<["Uses"]>(up, down):2
block:app
        columns 2
        application["application"]:2
        rest["API Rest"]
        backend(["Java Framework<br/>(Micronaut, Quarkus, Spring Boot)"]):1
        ui["User interface"]
        react(["React<br/>Single Page Application"]):1
        style backend fill:#fdd,stroke:#333,stroke-width:4px
        style app fill:#99d,stroke:#333,stroke-width:4px
    end
2. Implementation
Each implementation has its own repository :
| Framework | GitHub repository | Description |
|---|---|---|
A modern, jvm-based, full-stack framework for building modular, easily testable microservice and serverless applications. |
||
A Kubernetes Native Java stack tailored for OpenJDK HotSpot and GraalVM, crafted from the best of breed Java libraries and standards. |
||
Spring Boot makes it easy to create stand-alone, production-grade Spring based Applications that you can "just run". |
Each project structure is based on Maven Standard Directory Layout :
| path | description |
|---|---|
src/main/java |
Application (Micronaut / Quarkus / Spring Boot) sources |
src/main/resources |
Application (Micronaut / Quarkus / Spring Boot) resources |
src/main/react |
React front end sources |
src/test/java |
Test sources |
src/test/resources |
Test resources |
src/main/docker |
Dockerfile (JIT, native), docker-compose |
src/main/script |
Project scripts (simple benchmark and utilities) |
src/main/docs |
Project specific documentation assets |
README.md |
Readme |
CHANGELOG.md |
Changelog (keep a changelog style) |
LICENSE |
License |
CONTRIBUTING.md |
Contribution guide lines |
| Feature | Micronaut | Quarkus | Spring Boot |
|---|---|---|---|
Version |
4.10.x |
3.31.x |
3.5.x |
Java |
21 |
21 |
21 |
Virtual threads |
Yes |
Yes |
Yes |
HTTP 2 |
Yes |
Yes |
Yes |
Cache |
Caffeine |
Caffeine |
ConcurrentMap |
Native image |
GraalVM |
GraalVM |
GraalVM |
Containerized JIT |
Yes |
Yes |
Yes |
Containerized AOT |
Yes |
Yes |
Yes |
2.1. MongoDB collection definitions
Persistence layer is implemented through the no sql database MongoDB.
Failed to generate image: mmdc failed: Generating single mermaid chart

erDiagram
    PHOTOBOOK_META ||--o{ PHOTOBOOK_IMAGES : contains
Here are two sample documents :
{
    "photobookId":"springio23",
    "creationTime:":{"$timestamp":{"t":0,"i":0}},
    "modificationTime:":{"$timestamp":{"t":0,"i":0}},
    "author":"Fugerit",
    "labels": {
        "def": {
            "photobookTitle":"Spring I/O - Barcellona",
            "photobookDescription":"Breve album sull'esperienza allo Spring I/O 2023 di Barcellona"
        },
        "en": {
            "photobookTitle":"Spring I/O - Barcelona",
            "photobookDescription":"Brief summary of my experience at the Barcelona Spring I/O 2023"
        }
    }
}{
"imageId":1000,
"photobookId":"springio23",
"creationTime:":{"$timestamp":{"t":0,"i":0}},
"modificationTime:":{"$timestamp":{"t":0,"i":0}},
"author":"Fugerit",
"base64":"...",
"type":"jpg",
"labels": {
"def": {
"caption":"Ingresso alla \"Fira de Barcelona\" per la registrazione."
},
"en": {
"caption":"Entrance to the \"Fira de Barcelona\" for registration."
}
}
}A example init script can be found on the GitHub project :
https://github.com/fugerit-org/turbo-photobook/blob/main/src/test/resources/mongo-db/mongo-init.js
2.2. MongoDB aggregation pipelines
Database queries are implemented though MongoDB Aggregation pipelines.
Aggregations pipelines allow to process a document in multiple steps (stages).
Here are the aggregations currently used :
-
List photobooks
Applied to collection 'photobook_meta', list the photobooks contained in the database with page handling.
It is composed of some stages :
-
set labels based on language
-
sort the collection result
-
project the properties for the result (_id is excluded)
-
facet with meta informations for page handling
 [
  {
    $set:
      {
        info: {
          $ifNull: ["$labels.en", "$labels.def"],
        },
      },
  },
  {
    $sort:
      {
        photobookId: 1,
      },
  },
  {
    $project:
      {
        _id: 0,
        photobookId: 1,
        author: 1,
        info: 1,
      },
  },
  {
    $facet:
      {
        metadata: [
          {
            $count: "total",
          },
          {
            $addFields: {
              page: NumberInt(1),
            },
          },
        ],
        data: [
          {
            $skip: 0,
          },
          {
            $limit: 10,
          },
        ],
      },
  },
]-
List images in a photobook
Applied to collection 'photobook_images', list images contained in photobook with page handling.
It is composed of some stages :
-
match filter the selected photobook
-
sort the collection result
-
set labels based on language
-
project the properties for the result (_id is excluded, base64 is not included too)
-
facet with meta informations for page handling
[
  {
    $match: {
      photobookId: "springio23",
    },
  },
  {
    $sort:
      {
        imageId: 1,
      },
  },
  {
    $set: {
      info: {
        $ifNull: ["$labels.en", "$labels.def"],
      },
    },
  },
  {
    $project: {
	  _id:0,
	  imageId:1,
	  author:1,
	  type:1,
	  info:1
    },
  },
  {
    $facet: {
      metadata: [
        {
          $count: "total",
        },
        {
          $addFields: {
            page: NumberInt(1),
          },
        },
      ],
      data: [
        {
          $skip: 0,
        },
        {
          $limit: 30,
        },
      ],
    },
  },
]-
Image base64 content
Applied to collection 'photobook_images', retrieves only the base64 content for rendering.
It is composed of some stages :
-
match filter the selected image
-
project the properties for the result (only base64 content)
[
 {
   $match:
     {
       imageId: 1000,
       photobookId: "springio23",
     },
 },
 {
   $project:
     {
       _id: 0,
       base64: 1,
     },
 },
]
3. Benchmark (no resource limit)
This is a simple comparison benchmark between the same scenario for SpringBoot, Quarkus and Micronaut, both in JIT and AOT (GraalVM) version.
The specs of the system used for the runs are
-
AMD Ryzen 7 3700X 8 Core / 16 Threads
-
32 GB Memory
-
Ubuntu 24 OS
-
NVME disk
-
MongoDB 8.2.3 running as container and already initialized
Each run is composed of 250.000 request (two times, first for warm up, second for benchmark), with 8 connections.
Each sample shows the hey command result and the psrecord plotted image.
In this scenario, no resource cap has been set
3.1. SpringBoot JIT Benchmark
Summary:
  Total:        44.2034 secs
  Slowest:      0.0107 secs
  Fastest:      0.0006 secs
  Average:      0.0014 secs
  Requests/sec: 5655.6790


Response time histogram:
  0.001 [1]     |
  0.002 [185744]        |■■■■■■■■■■■■■■■■■■■■■■■■■■■■■■■■■■■■■■■■
  0.003 [63096] |■■■■■■■■■■■■■■
  0.004 [828]   |
  0.005 [133]   |
  0.006 [77]    |
  0.007 [67]    |
  0.008 [12]    |
  0.009 [25]    |
  0.010 [12]    |
  0.011 [5]     |


Latency distribution:
  10% in 0.0011 secs
  25% in 0.0012 secs
  50% in 0.0014 secs
  75% in 0.0016 secs
  90% in 0.0018 secs
  95% in 0.0019 secs
  99% in 0.0023 secs

Details (average, fastest, slowest):
  DNS+dialup:   0.0000 secs, 0.0006 secs, 0.0107 secs
  DNS-lookup:   0.0000 secs, 0.0000 secs, 0.0007 secs
  req write:    0.0000 secs, 0.0000 secs, 0.0010 secs
  resp wait:    0.0014 secs, 0.0005 secs, 0.0106 secs
  resp read:    0.0000 secs, 0.0000 secs, 0.0020 secs

Status code distribution:
  [200] 250000 responses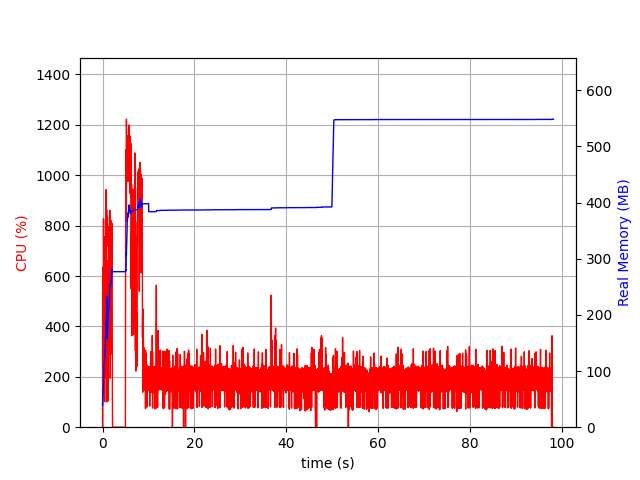
3.2. SpringBoot AOT Benchmark
Summary:
  Total:        49.0908 secs
  Slowest:      0.0162 secs
  Fastest:      0.0007 secs
  Average:      0.0016 secs
  Requests/sec: 5092.6056


Response time histogram:
  0.001 [1]     |
  0.002 [235922]        |■■■■■■■■■■■■■■■■■■■■■■■■■■■■■■■■■■■■■■■■
  0.004 [12357] |■■
  0.005 [459]   |
  0.007 [160]   |
  0.008 [756]   |
  0.010 [236]   |
  0.012 [82]    |
  0.013 [17]    |
  0.015 [4]     |
  0.016 [6]     |


Latency distribution:
  10% in 0.0011 secs
  25% in 0.0013 secs
  50% in 0.0015 secs
  75% in 0.0017 secs
  90% in 0.0020 secs
  95% in 0.0023 secs
  99% in 0.0033 secs

Details (average, fastest, slowest):
  DNS+dialup:   0.0000 secs, 0.0007 secs, 0.0162 secs
  DNS-lookup:   0.0000 secs, 0.0000 secs, 0.0011 secs
  req write:    0.0000 secs, 0.0000 secs, 0.0017 secs
  resp wait:    0.0015 secs, 0.0006 secs, 0.0161 secs
  resp read:    0.0000 secs, 0.0000 secs, 0.0121 secs

Status code distribution:
  [200] 250000 responses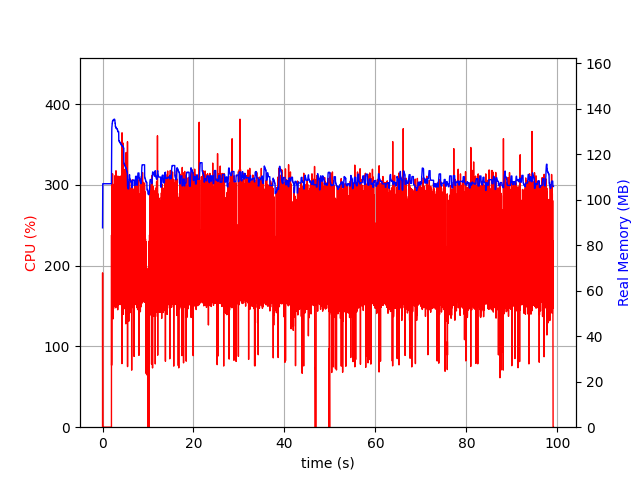
3.3. Quarkus JIT Benchmark
Summary:
  Total:        42.1730 secs
  Slowest:      0.0372 secs
  Fastest:      0.0006 secs
  Average:      0.0013 secs
  Requests/sec: 5927.9662

  Total data:   46000000 bytes
  Size/request: 184 bytes

Response time histogram:
  0.001 [1]     |
  0.004 [249721]        |■■■■■■■■■■■■■■■■■■■■■■■■■■■■■■■■■■■■■■■■
  0.008 [201]   |
  0.012 [28]    |
  0.015 [22]    |
  0.019 [11]    |
  0.023 [0]     |
  0.026 [8]     |
  0.030 [0]     |
  0.034 [0]     |
  0.037 [8]     |


Latency distribution:
  10% in 0.0010 secs
  25% in 0.0012 secs
  50% in 0.0013 secs
  75% in 0.0015 secs
  90% in 0.0017 secs
  95% in 0.0018 secs
  99% in 0.0023 secs

Details (average, fastest, slowest):
  DNS+dialup:   0.0000 secs, 0.0006 secs, 0.0372 secs
  DNS-lookup:   0.0000 secs, 0.0000 secs, 0.0005 secs
  req write:    0.0000 secs, 0.0000 secs, 0.0013 secs
  resp wait:    0.0013 secs, 0.0005 secs, 0.0370 secs
  resp read:    0.0000 secs, 0.0000 secs, 0.0014 secs

Status code distribution:
  [200] 250000 responses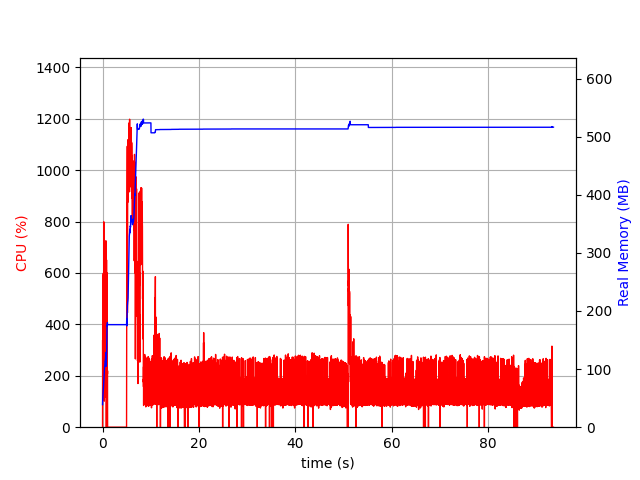
3.4. Quarkus AOT Benchmark
Summary:
  Total:        45.0965 secs
  Slowest:      0.0146 secs
  Fastest:      0.0006 secs
  Average:      0.0014 secs
  Requests/sec: 5543.6629

  Total data:   46000000 bytes
  Size/request: 184 bytes

Response time histogram:
  0.001 [1]     |
  0.002 [237795]        |■■■■■■■■■■■■■■■■■■■■■■■■■■■■■■■■■■■■■■■■
  0.003 [10090] |■■
  0.005 [473]   |
  0.006 [1290]  |
  0.008 [274]   |
  0.009 [52]    |
  0.010 [17]    |
  0.012 [7]     |
  0.013 [0]     |
  0.015 [1]     |


Latency distribution:
  10% in 0.0011 secs
  25% in 0.0012 secs
  50% in 0.0014 secs
  75% in 0.0016 secs
  90% in 0.0018 secs
  95% in 0.0020 secs
  99% in 0.0031 secs

Details (average, fastest, slowest):
  DNS+dialup:   0.0000 secs, 0.0006 secs, 0.0146 secs
  DNS-lookup:   0.0000 secs, 0.0000 secs, 0.0004 secs
  req write:    0.0000 secs, 0.0000 secs, 0.0010 secs
  resp wait:    0.0014 secs, 0.0006 secs, 0.0145 secs
  resp read:    0.0000 secs, 0.0000 secs, 0.0008 secs

Status code distribution:
  [200] 250000 responses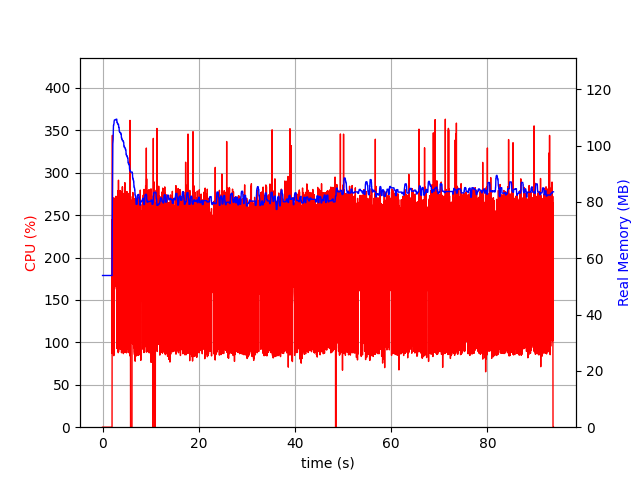
3.5. Micronaut JIT Benchmark
Summary:
  Total:        44.7587 secs
  Slowest:      0.0101 secs
  Fastest:      0.0005 secs
  Average:      0.0014 secs
  Requests/sec: 5585.5066

  Total data:   46000000 bytes
  Size/request: 184 bytes

Response time histogram:
  0.001 [1]     |
  0.001 [154273]        |■■■■■■■■■■■■■■■■■■■■■■■■■■■■■■■■■■■■■■■■
  0.002 [93279] |■■■■■■■■■■■■■■■■■■■■■■■■
  0.003 [1778]  |
  0.004 [275]   |
  0.005 [156]   |
  0.006 [103]   |
  0.007 [48]    |
  0.008 [39]    |
  0.009 [33]    |
  0.010 [15]    |


Latency distribution:
  10% in 0.0011 secs
  25% in 0.0012 secs
  50% in 0.0014 secs
  75% in 0.0016 secs
  90% in 0.0018 secs
  95% in 0.0019 secs
  99% in 0.0024 secs

Details (average, fastest, slowest):
  DNS+dialup:   0.0000 secs, 0.0005 secs, 0.0101 secs
  DNS-lookup:   0.0000 secs, 0.0000 secs, 0.0005 secs
  req write:    0.0000 secs, 0.0000 secs, 0.0025 secs
  resp wait:    0.0014 secs, 0.0005 secs, 0.0101 secs
  resp read:    0.0000 secs, 0.0000 secs, 0.0016 secs

Status code distribution:
  [200] 250000 responses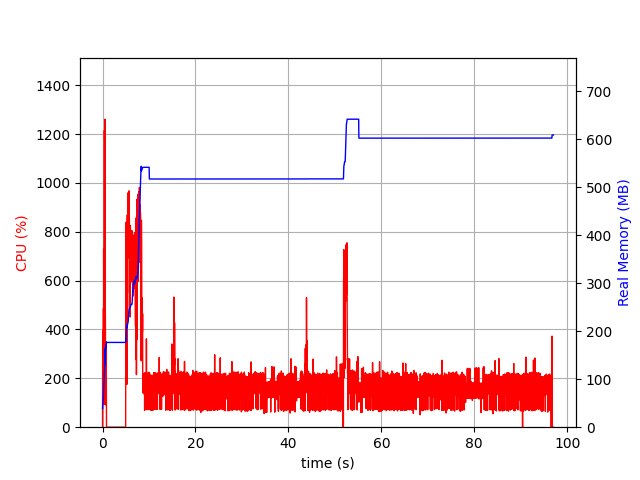
3.6. Micronaut AOT Benchmark
Summary:
  Total:        48.0014 secs
  Slowest:      0.0126 secs
  Fastest:      0.0006 secs
  Average:      0.0015 secs
  Requests/sec: 5208.1784

  Total data:   46000000 bytes
  Size/request: 184 bytes

Response time histogram:
  0.001 [1]     |
  0.002 [207056]        |■■■■■■■■■■■■■■■■■■■■■■■■■■■■■■■■■■■■■■■■
  0.003 [38944] |■■■■■■■■
  0.004 [1949]  |
  0.005 [558]   |
  0.007 [1017]  |
  0.008 [314]   |
  0.009 [103]   |
  0.010 [41]    |
  0.011 [9]     |
  0.013 [8]     |


Latency distribution:
  10% in 0.0011 secs
  25% in 0.0013 secs
  50% in 0.0014 secs
  75% in 0.0017 secs
  90% in 0.0019 secs
  95% in 0.0022 secs
  99% in 0.0035 secs

Details (average, fastest, slowest):
  DNS+dialup:   0.0000 secs, 0.0006 secs, 0.0126 secs
  DNS-lookup:   0.0000 secs, 0.0000 secs, 0.0004 secs
  req write:    0.0000 secs, 0.0000 secs, 0.0014 secs
  resp wait:    0.0015 secs, 0.0005 secs, 0.0126 secs
  resp read:    0.0000 secs, 0.0000 secs, 0.0013 secs

Status code distribution:
  [200] 250000 responses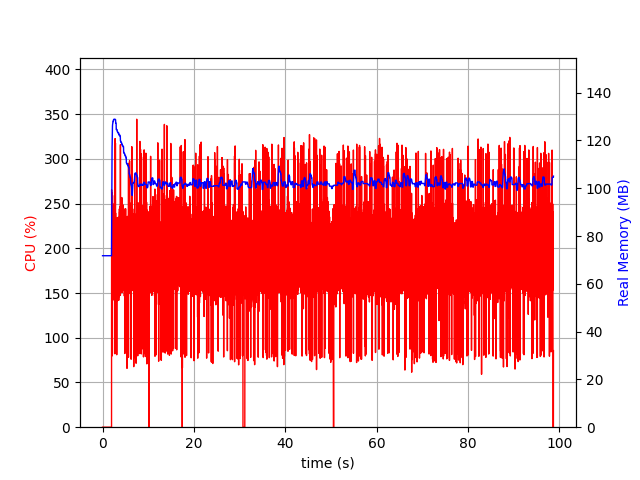
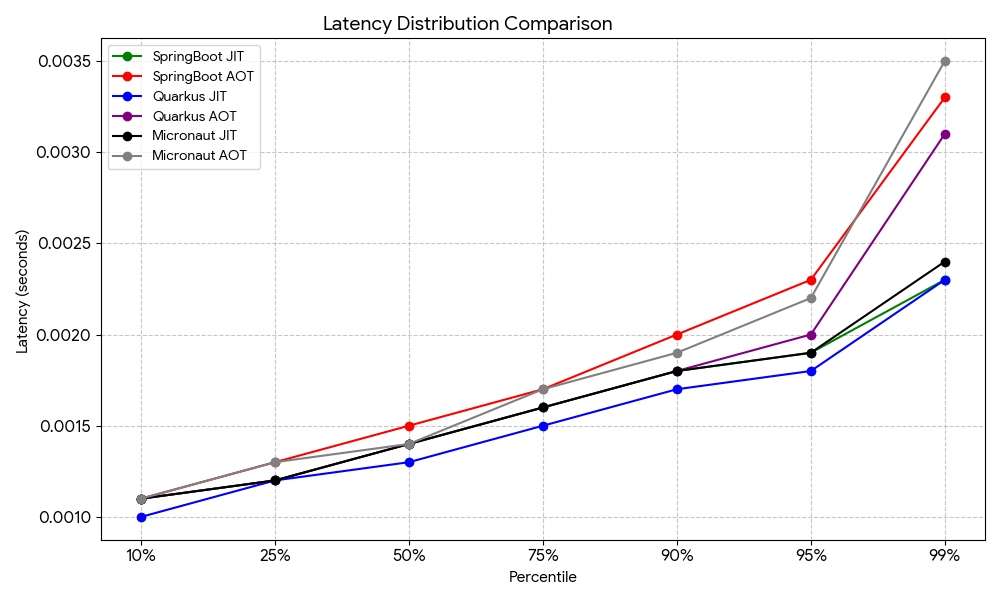
3.7. Comparison
This benchmark is far from complete. With different scenarios and/or optimizations the result could be different.
This said, resource consumption and performance seems similar across the JIT runs and the AOT runs for all three Frameworks.
Quarkus seems to have a slight advantage regarding both latency and memory footprint.
| this is a specific scenario and there is no resource cap. |
| Latency % | SpringBoot JIT | SpringBoot AOT | Quarkus JIT | Quarkus AOT | Micronaut JIT | Micronaut AOT |
|---|---|---|---|---|---|---|
10% |
0.0011s |
0.0011s |
0.0010s |
0.0011s |
0.0011s |
0.0011s |
25% |
0.0012s |
0.0013s |
0.0012s |
0.0012s |
0.0012s |
0.0013s |
50% |
0.0014s |
0.0015s |
0.0013s |
0.0014s |
0.0014s |
0.0014s |
75% |
0.0016s |
0.0017s |
0.0015s |
0.0016s |
0.0016s |
0.0017s |
90% |
0.0018s |
0.0020s |
0.0017s |
0.0018s |
0.0018s |
0.0019s |
95% |
0.0019s |
0.0023s |
0.0018s |
0.0020s |
0.0019s |
0.0022s |
99% |
0.0023s |
0.0033s |
0.0023s |
0.0031s |
0.0024s |
0.0035s |
4. Benchmark (with resource limit)
This is a simple comparison benchmark between the same scenario for SpringBoot, Quarkus and Micronaut, both in JIT and AOT (GraalVM) version.
The specs of the system used for the runs are
-
AMD Ryzen 7 3700X 8 Core / 16 Threads
-
32 GB Memory
-
Ubuntu 24 OS
-
NVME disk
-
MongoDB 8.2.3 running as container and already initialized
-
Docker 27.2
The benchmark tool used is hey.
Each run is composed of 250.000 request (two times, first for warm up, second for benchmark), with 8 connections.
Resource cap has been set on docker containers :
-
mongo db - 2CPU, 2GB
-
JIT microservice - 1CPU, 500M
-
APT microservice - 1CPU, 200M
4.1. SpringBoot JIT Benchmark (container, with resource limit)
-
Docker image : fugeritorg/springboot-photobook:v2.3.1
-
Startup time : about 4000 ms
-
CPU : 1
-
Memory : 500M
Summary:
  Total:        55.3979 secs
  Slowest:      0.0712 secs
  Fastest:      0.0005 secs
  Average:      0.0018 secs
  Requests/sec: 4512.8037


Response time histogram:
  0.000 [1]     |
  0.008 [245561]        |■■■■■■■■■■■■■■■■■■■■■■■■■■■■■■■■■■■■■■■■
  0.015 [15]    |
  0.022 [0]     |
  0.029 [8]     |
  0.036 [8]     |
  0.043 [28]    |
  0.050 [1602]  |
  0.057 [2559]  |
  0.064 [128]   |
  0.071 [90]    |


Latency distribution:
  10% in 0.0007 secs
  25% in 0.0007 secs
  50% in 0.0008 secs
  75% in 0.0010 secs
  90% in 0.0012 secs
  95% in 0.0014 secs
  99% in 0.0503 secs

Details (average, fastest, slowest):
  DNS+dialup:   0.0000 secs, 0.0005 secs, 0.0712 secs
  DNS-lookup:   0.0000 secs, 0.0000 secs, 0.0018 secs
  req write:    0.0000 secs, 0.0000 secs, 0.0040 secs
  resp wait:    0.0017 secs, 0.0004 secs, 0.0712 secs
  resp read:    0.0000 secs, 0.0000 secs, 0.0540 secs

Status code distribution:
  [200] 250000 responses
4.2. SpringBoot AOT Benchmark (container, with resource limit)
-
Docker image : fugeritorg/springboot-photobook:v2.3.1-native
-
Startup time : about 25 ms
-
CPU : 1
-
Memory : 200M
Summary:
  Total:        66.9154 secs
  Slowest:      0.0217 secs
  Fastest:      0.0006 secs
  Average:      0.0021 secs
  Requests/sec: 3736.0611


Response time histogram:
  0.001 [1]     |
  0.003 [230885]        |■■■■■■■■■■■■■■■■■■■■■■■■■■■■■■■■■■■■■■■■
  0.005 [12483] |■■
  0.007 [197]   |
  0.009 [1361]  |
  0.011 [1869]  |
  0.013 [2189]  |
  0.015 [750]   |
  0.017 [163]   |
  0.020 [61]    |
  0.022 [41]    |


Latency distribution:
  10% in 0.0017 secs
  25% in 0.0017 secs
  50% in 0.0018 secs
  75% in 0.0020 secs
  90% in 0.0023 secs
  95% in 0.0029 secs
  99% in 0.0116 secs

Details (average, fastest, slowest):
  DNS+dialup:   0.0000 secs, 0.0006 secs, 0.0217 secs
  DNS-lookup:   0.0000 secs, 0.0000 secs, 0.0015 secs
  req write:    0.0000 secs, 0.0000 secs, 0.0018 secs
  resp wait:    0.0021 secs, 0.0005 secs, 0.0216 secs
  resp read:    0.0000 secs, 0.0000 secs, 0.0146 secs

Status code distribution:
  [200] 250000 responses
4.3. Quarkus JIT Benchmark (container, with resource limit)
-
Docker image : fugeritorg/quarkus-photobook:v1.1.2
-
Startup time : about 2000 ms
-
CPU : 1
-
Memory : 500M
Summary:
  Total:        46.0769 secs
  Slowest:      0.0729 secs
  Fastest:      0.0004 secs
  Average:      0.0015 secs
  Requests/sec: 5425.7127

  Total data:   46000000 bytes
  Size/request: 184 bytes

Response time histogram:
  0.000 [1]     |
  0.008 [246313]        |■■■■■■■■■■■■■■■■■■■■■■■■■■■■■■■■■■■■■■■■
  0.015 [0]     |
  0.022 [0]     |
  0.029 [8]     |
  0.037 [8]     |
  0.044 [213]   |
  0.051 [3088]  |■
  0.058 [113]   |
  0.066 [29]    |
  0.073 [227]   |


Latency distribution:
  10% in 0.0006 secs
  25% in 0.0006 secs
  50% in 0.0007 secs
  75% in 0.0008 secs
  90% in 0.0011 secs
  95% in 0.0013 secs
  99% in 0.0461 secs

Details (average, fastest, slowest):
  DNS+dialup:   0.0000 secs, 0.0004 secs, 0.0729 secs
  DNS-lookup:   0.0000 secs, 0.0000 secs, 0.0005 secs
  req write:    0.0000 secs, 0.0000 secs, 0.0007 secs
  resp wait:    0.0014 secs, 0.0004 secs, 0.0729 secs
  resp read:    0.0000 secs, 0.0000 secs, 0.0007 secs

Status code distribution:
  [200] 250000 responses
4.4. Quarkus AOT Benchmark (container, with resource limit)
-
Docker image : fugeritorg/quarkus-photobook:v1.1.2-native
-
Startup time : about 20 ms
-
CPU : 1
-
Memory : 200M
Summary:
  Total:        61.7660 secs
  Slowest:      0.0496 secs
  Fastest:      0.0005 secs
  Average:      0.0020 secs
  Requests/sec: 4047.5363

  Total data:   46000000 bytes
  Size/request: 184 bytes

Response time histogram:
  0.001 [1]     |
  0.005 [244902]        |■■■■■■■■■■■■■■■■■■■■■■■■■■■■■■■■■■■■■■■■
  0.010 [153]   |
  0.015 [8]     |
  0.020 [0]     |
  0.025 [0]     |
  0.030 [0]     |
  0.035 [52]    |
  0.040 [1589]  |
  0.045 [3012]  |
  0.050 [283]   |


Latency distribution:
  10% in 0.0009 secs
  25% in 0.0010 secs
  50% in 0.0011 secs
  75% in 0.0013 secs
  90% in 0.0016 secs
  95% in 0.0021 secs
  99% in 0.0408 secs

Details (average, fastest, slowest):
  DNS+dialup:   0.0000 secs, 0.0005 secs, 0.0496 secs
  DNS-lookup:   0.0000 secs, 0.0000 secs, 0.0004 secs
  req write:    0.0000 secs, 0.0000 secs, 0.0005 secs
  resp wait:    0.0019 secs, 0.0005 secs, 0.0496 secs
  resp read:    0.0000 secs, 0.0000 secs, 0.0008 secs

Status code distribution:
  [200] 250000 responses
4.5. Micronaut JIT Benchmark (container, with resource limit)
-
Docker image : fugeritorg/micronaut-photobook:v1.1.1
-
Startup time : about 2000 ms
-
CPU : 1
-
Memory : 500M
Summary:
  Total:        40.3541 secs
  Slowest:      0.0635 secs
  Fastest:      0.0004 secs
  Average:      0.0013 secs
  Requests/sec: 6195.1607

  Total data:   46000000 bytes
  Size/request: 184 bytes

Response time histogram:
  0.000 [1]     |
  0.007 [246764]        |■■■■■■■■■■■■■■■■■■■■■■■■■■■■■■■■■■■■■■■■
  0.013 [5]     |
  0.019 [8]     |
  0.026 [0]     |
  0.032 [9]     |
  0.038 [153]   |
  0.045 [2503]  |
  0.051 [501]   |
  0.057 [40]    |
  0.064 [16]    |


Latency distribution:
  10% in 0.0006 secs
  25% in 0.0006 secs
  50% in 0.0007 secs
  75% in 0.0008 secs
  90% in 0.0010 secs
  95% in 0.0011 secs
  99% in 0.0409 secs

Details (average, fastest, slowest):
  DNS+dialup:   0.0000 secs, 0.0004 secs, 0.0635 secs
  DNS-lookup:   0.0000 secs, 0.0000 secs, 0.0005 secs
  req write:    0.0000 secs, 0.0000 secs, 0.0007 secs
  resp wait:    0.0013 secs, 0.0004 secs, 0.0635 secs
  resp read:    0.0000 secs, 0.0000 secs, 0.0031 secs

Status code distribution:
  [200] 250000 responses
4.6. Micronaut AOT Benchmark (container, with resource limit)
-
Docker image : fugeritorg/micronaut-photobook:v1.1.1-native
-
Startup time : about 15 ms
-
CPU : 1
-
Memory : 200M
Summary:
Total: 49.1055 secs
Slowest: 0.0460 secs
Fastest: 0.0005 secs
Average: 0.0016 secs
Requests/sec: 5091.0743
Total data: 46000000 bytes
Size/request: 184 bytes
Response time histogram:
0.001 [1] |
0.005 [245873] |■■■■■■■■■■■■■■■■■■■■■■■■■■■■■■■■■■■■■■■■
0.010 [214] |
0.014 [8] |
0.019 [0] |
0.023 [12] |
0.028 [12] |
0.032 [34] |
0.037 [1727] |
0.041 [1937] |
0.046 [182] |
Latency distribution:
10% in 0.0008 secs
25% in 0.0008 secs
50% in 0.0009 secs
75% in 0.0011 secs
90% in 0.0013 secs
95% in 0.0018 secs
99% in 0.0364 secs
Details (average, fastest, slowest):
DNS+dialup: 0.0000 secs, 0.0005 secs, 0.0460 secs
DNS-lookup: 0.0000 secs, 0.0000 secs, 0.0004 secs
req write: 0.0000 secs, 0.0000 secs, 0.0007 secs
resp wait: 0.0015 secs, 0.0005 secs, 0.0460 secs
resp read: 0.0000 secs, 0.0000 secs, 0.0009 secs
Status code distribution:
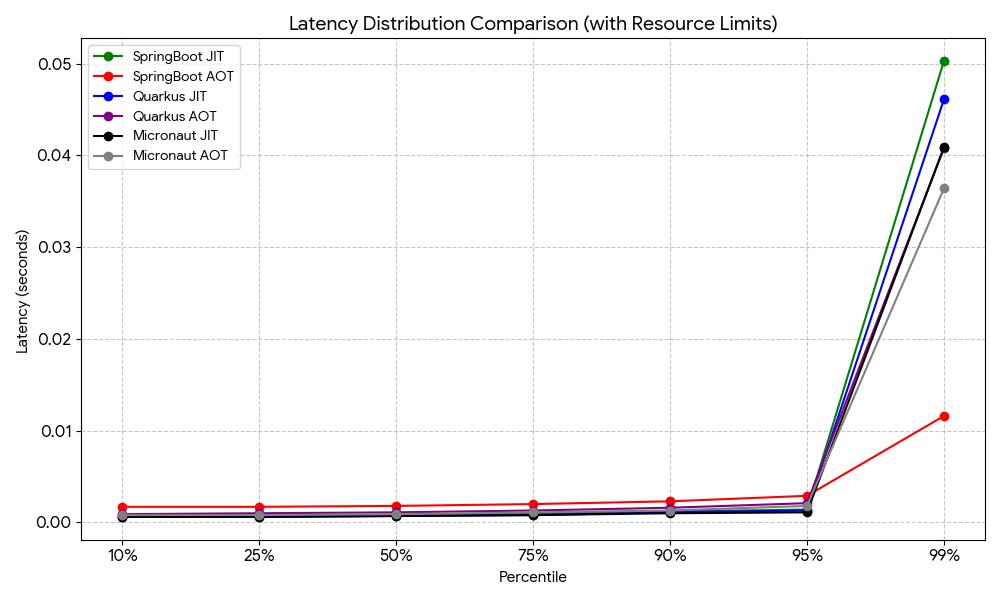
[200] 250000 responses4.7. Comparison with resource limit
| Latency % | SpringBoot JIT | SpringBoot AOT | Quarkus JIT | Quarkus AOT | Micronaut JIT | Micronaut AOT |
|---|---|---|---|---|---|---|
10% |
0.0007s |
0.0017s |
0.0006s |
0.0009s |
0.0006s |
0.0008s |
25% |
0.0007s |
0.0017s |
0.0006s |
0.0010s |
0.0006s |
0.0008s |
50% |
0.0008s |
0.0018s |
0.0007s |
0.0011s |
0.0007s |
0.0009s |
75% |
0.0010s |
0.0020s |
0.0008s |
0.0013s |
0.0008s |
0.0011s |
90% |
0.0012s |
0.0023s |
0.0011s |
0.0016s |
0.0010s |
0.0013s |
95% |
0.0014s |
0.0029s |
0.0013s |
0.0021s |
0.0011s |
0.0018s |
99% |
0.0503s |
0.0116s |
0.0461s |
0.0408s |
0.0409s |
0.0364s |